      mean median count
1 70.45371 75 53981Report
The source of the data was from data pulled from the Steam API and various rating websites from 2012 to 2022. The observations include: Steam id, Steam store user score, name, full price, platforms, categories, all listed genres on Steam, GFQ reported difficulty, GFQ reported rating, GFQ reported length, MetaCritic score, MetaCritic user score, IGDB score, and the IGDB user score. This includes a variety of different rating websites.
The research question we are interested in answering is: What factors, such as price, platform availability, genres, tags, length, or difficulty, affect the user ratings for games on Steam from 2012 to 2022?
Understanding the factors influencing video game user ratings is crucial for game developers to enhance their products, empower gamers to make informed choices, and foster a competitive industry. It provides insights into player preferences, facilitates market adaptation, and contributes to the overall evolution of gaming standards.
Article citation : Qaffas, Alaa A. “An Operational Study of Video Games’ Genres.” International Journal of Interactive Mobile Technologies (iJIM), online-journals.org/index.php/i-jim/article/view/16691.
The article discusses the 100 most ranked games, which are represented by 16 genres: adventure, role-playing, shooter, platform, puzzle, strategy, hack and slash/beat ’em up, real-time strategy, turn-based strategy, point-and-click, indie, racing, sport, fighting, arcade, and simulator games. Six genres among the 16 represent 0.83 of the successful games: adventure, RPG, shooter, platform, puzzle, and strategy. This leads them to recommend future games that combine the other categories into these six genres.
Ethical Concerns: While researching factors influencing video game user ratings can provide valuable insights, several ethical concerns should be considered, including privacy and consent, data security, and bias and fairness.
The research involves analyzing user and company data, which means that ensuring that it’s anonymized and obtained with clear user consent is essential. Steam has allowed the public access to its API to gather information, and we believe that we should be able to ethically use the data.
Additionally, we should take into account the possibility of our findings negatively influencing developers of certain games, as our data may influence some to stay away from certain types of games. Therefore, we believe that we should inform anyone using this information to not automatically assume our findings to be true for every game, as there may be outliers and exceptions.

mean median count
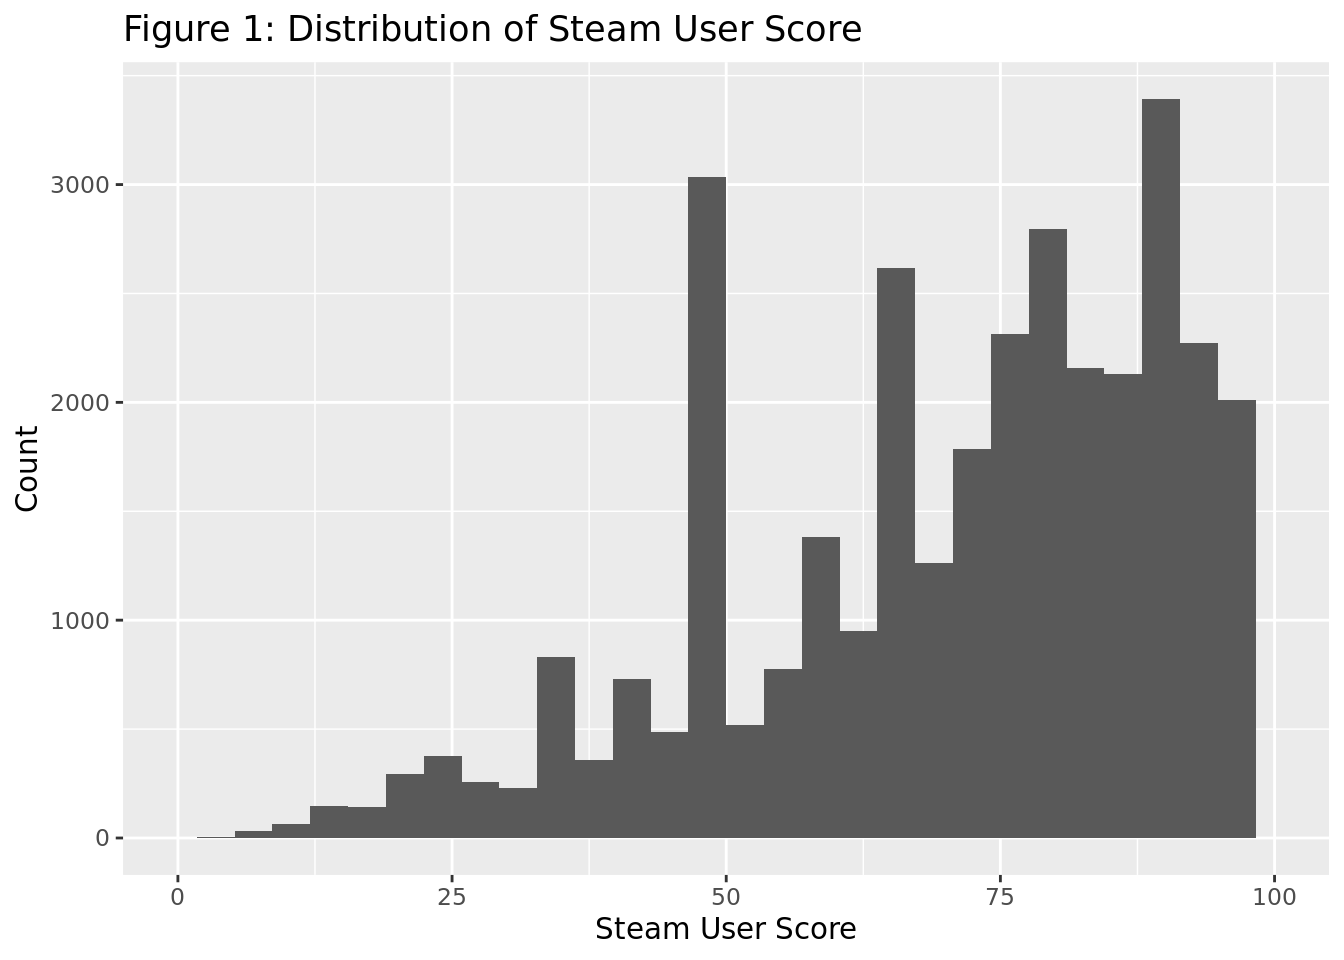
1 70.45371 75 53981There are 53981 different games included in the dataset. There is a significant left skew, with there being more higher rated games than lower rated games. The mean of the dataset is a score of 70.5, while the median is a score of 75.
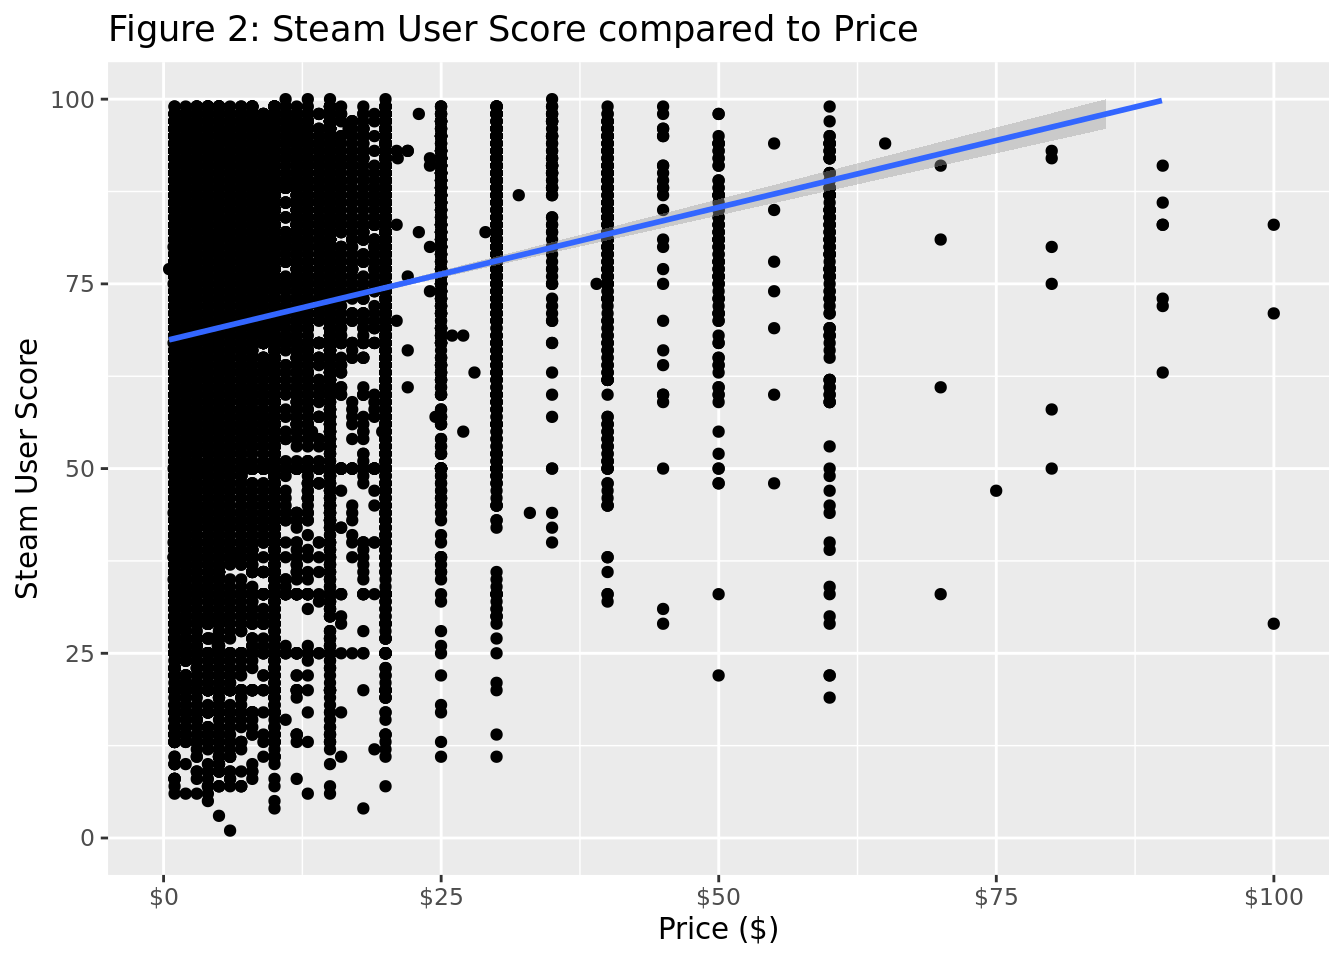
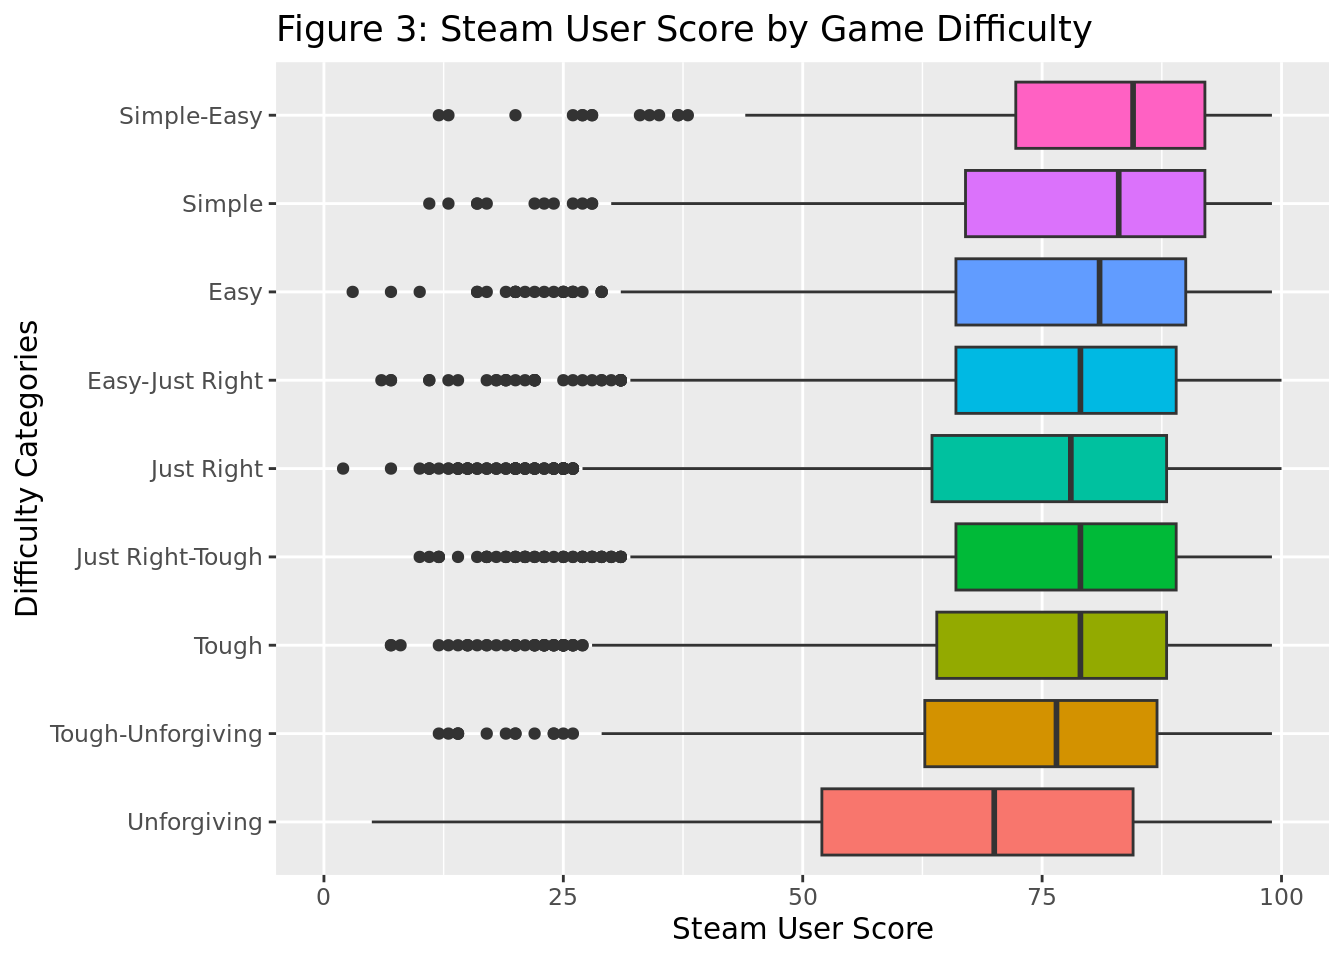
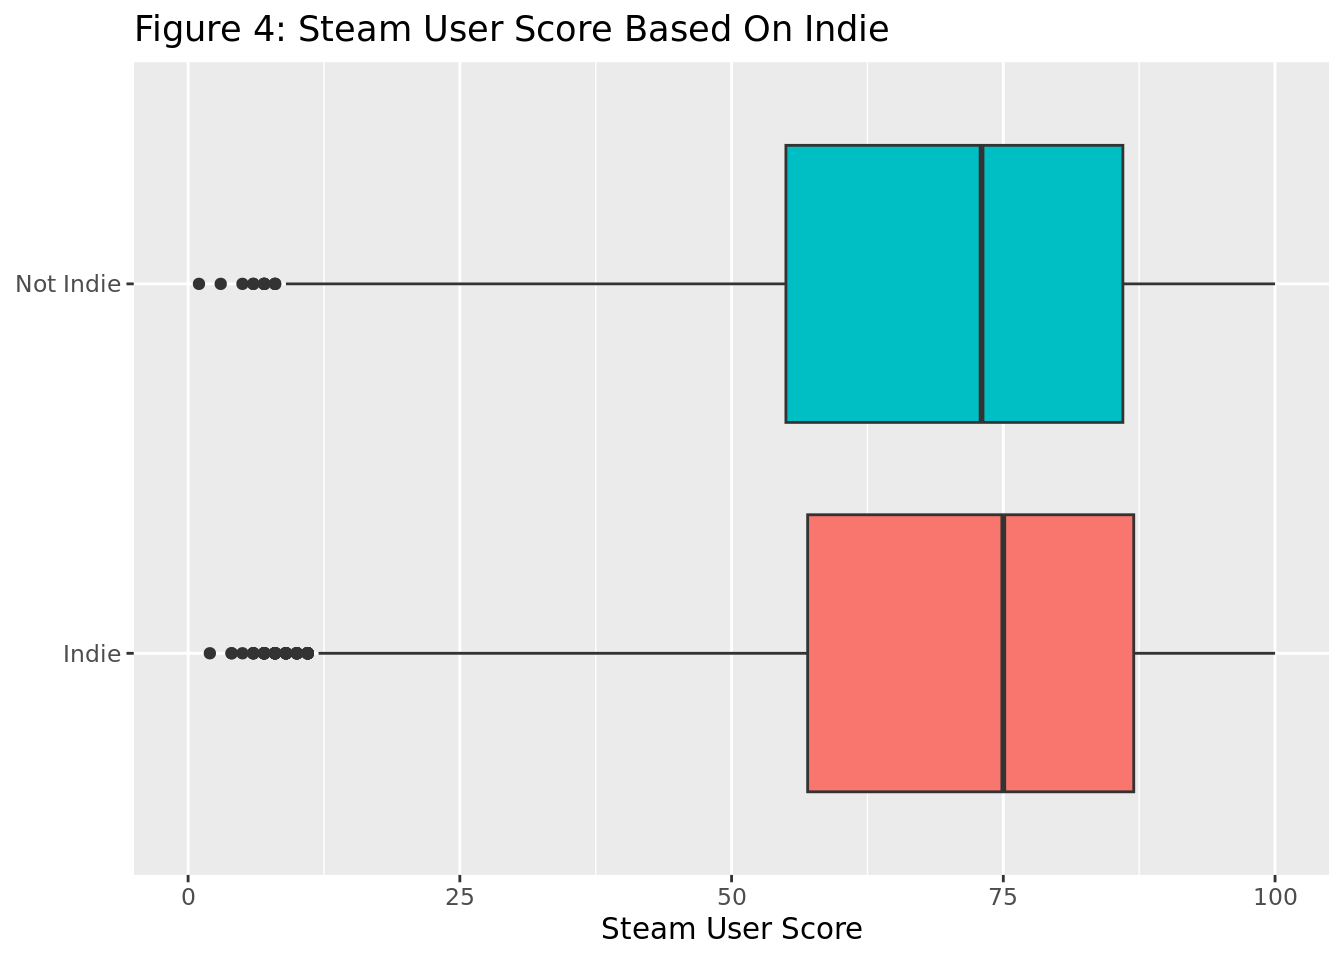
In order to see what genres are useful for predicting the steam user score, we made a linear model, first comparing the store user score to the price of the game. We compared this as we were convinced that there is a relationship between these variables. After, we added all the genres into a stepAIC function, which finds the most optimal model for the given variables. Because stepAIC penalizes for having more variables, we can be sure that any variable that gets included is able to better predict the steam user score. We made an optimal model below based off of the best model stepAIC gave us.
# A tibble: 14 × 5
   term                     estimate std.error statistic   p.value
   <chr>                       <dbl>     <dbl>     <dbl>     <dbl>
 1 (Intercept)              69.5      0.328       212.   0
 2 as.double(full_price)     0.00230  0.000106     21.7  4.67e-104
 3 Simulation               -4.58     0.306       -15.0  1.64e- 50
 4 Violent                 -10.9      0.841       -12.9  4.74e- 38
 5 Indie                     2.57     0.272         9.45 3.58e- 21
 6 `Massively Multiplayer`  -6.08     0.966        -6.30 3.09e- 10
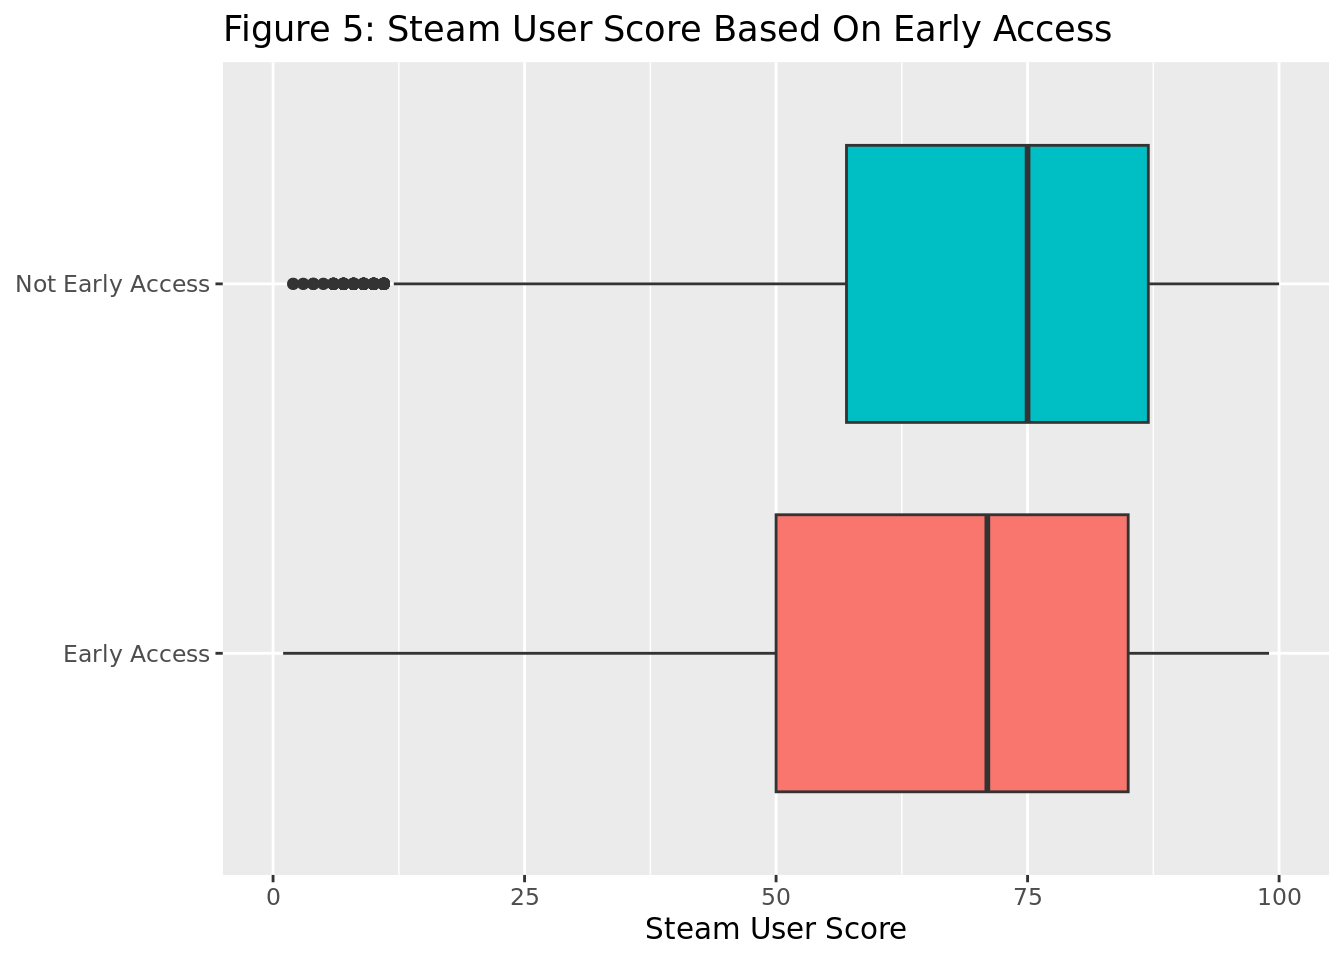
 7 `Early Access`           -2.22     0.381        -5.81 6.23e-  9
 8 Action                   -1.52     0.243        -6.27 3.60e- 10
 9 Sports                   -2.21     0.563        -3.93 8.57e-  5
10 Casual                   -1.04     0.247        -4.19 2.82e-  5
11 Strategy                 -1.38     0.300        -4.61 3.96e-  6
12 Racing                   -2.20     0.619        -3.56 3.78e-  4
13 RPG                       0.903    0.319         2.83 4.63e-  3
14 Adventure                -0.495    0.245        -2.02 4.30e-  2
# A tibble: 1 × 12
r.squared adj.r.squared sigma statistic p.value df logLik AIC BIC
<dbl> <dbl> <dbl> <dbl> <dbl> <dbl> <dbl> <dbl> <dbl>
1 0.0384 0.0380 19.5 89.5 9.63e-236 13 -127822. 2.56e5 2.56e5
# ℹ 3 more variables: deviance <dbl>, df.residual <int>, nobs <int>Our model shows that for a game with none of the above genres, and a price of zero, we estimate an average rating is 69.5. We also estimate that for every one cent that the price increases, the user score increases by an average of 0.002. Alternatively this could be stated as an estimated average increase of 0.2 for every dollar increase. Many of the genres show an increase or decrease in expected rating as well. For games with the violent genre, we estimate on average a 10.86 decrease in the user rating. And for indie games, we estimate on average a 2.57 increase in user rating.
Taking a glance at our model, we find an adjusted R squared of 0.038. This number is very low, meaning that only about 3.8% of the variability in the data is explained by our variables. We believe that this makes sense, as there are many, many factors that go into the rating and quality of games, and genre and price are only a small fraction of that. We believe that if we could add more factors such as the category, platform, or other ratings of the games, we would see a higher R squared value.