Intro to R + Data Visualization - Suggested Answers

For this ae, we’ll use the tidyverse and palmerpenguins packages.

Packages

Warning: package 'ggplot2' was built under R version 4.3.3
Warning: package 'tidyr' was built under R version 4.3.3
Warning: package 'readr' was built under R version 4.3.3
Warning: package 'dplyr' was built under R version 4.3.3
Warning: package 'stringr' was built under R version 4.3.3
Warning: package 'lubridate' was built under R version 4.3.3
── Attaching core tidyverse packages ──────────────────────── tidyverse 2.0.0 ──
✔ dplyr     1.1.4     ✔ readr     2.1.5
✔ forcats   1.0.0     ✔ stringr   1.5.1
✔ ggplot2   3.5.0     ✔ tibble    3.2.1
✔ lubridate 1.9.3     ✔ tidyr     1.3.1
✔ purrr     1.0.1     
── Conflicts ────────────────────────────────────────── tidyverse_conflicts() ──
✖ dplyr::filter() masks stats::filter()
✖ dplyr::lag()    masks stats::lag()
ℹ Use the conflicted package (<http://conflicted.r-lib.org/>) to force all conflicts to become errors
library(palmerpenguins) #The data set name is penguins

What are the #| above?

code chunk arguments

Which ones will we use during the semester? State and define them below.

message; turns of messages from output

warning; turns of warnings from output

eval; makes code chunk not run in the rendered output

echo; makes code not appear in rendered output

Data

The dataset we will visualize is called penguins. Let’s glimpse() at it.

glimpse(penguins)
Rows: 344
Columns: 8
$ species           <fct> Adelie, Adelie, Adelie, Adelie, Adelie, Adelie, Adel…
$ island            <fct> Torgersen, Torgersen, Torgersen, Torgersen, Torgerse…
$ bill_length_mm    <dbl> 39.1, 39.5, 40.3, NA, 36.7, 39.3, 38.9, 39.2, 34.1, …
$ bill_depth_mm     <dbl> 18.7, 17.4, 18.0, NA, 19.3, 20.6, 17.8, 19.6, 18.1, …
$ flipper_length_mm <int> 181, 186, 195, NA, 193, 190, 181, 195, 193, 190, 186…
$ body_mass_g       <int> 3750, 3800, 3250, NA, 3450, 3650, 3625, 4675, 3475, …
$ sex               <fct> male, female, female, NA, female, male, female, male…
$ year              <int> 2007, 2007, 2007, 2007, 2007, 2007, 2007, 2007, 2007…

Now, pipe the penguins data into the glimpse function to produce the same result.

penguins |>
  glimpse()
Rows: 344
Columns: 8
$ species           <fct> Adelie, Adelie, Adelie, Adelie, Adelie, Adelie, Adel…
$ island            <fct> Torgersen, Torgersen, Torgersen, Torgersen, Torgerse…
$ bill_length_mm    <dbl> 39.1, 39.5, 40.3, NA, 36.7, 39.3, 38.9, 39.2, 34.1, …
$ bill_depth_mm     <dbl> 18.7, 17.4, 18.0, NA, 19.3, 20.6, 17.8, 19.6, 18.1, …
$ flipper_length_mm <int> 181, 186, 195, NA, 193, 190, 181, 195, 193, 190, 186…
$ body_mass_g       <int> 3750, 3800, 3250, NA, 3450, 3650, 3625, 4675, 3475, …
$ sex               <fct> male, female, female, NA, female, male, female, male…
$ year              <int> 2007, 2007, 2007, 2007, 2007, 2007, 2007, 2007, 2007…
What types of variables are we working with in this data set?

fct - factor - categorical int - integer - quantitative dbl - double - quantitative

variables we don’t see include: chr - character = words = categorical

log = logical = true/false = categorical

Visualizing penguin weights - Demo

Single variable

Note

Analyzing the a single variable is called univariate analysis.

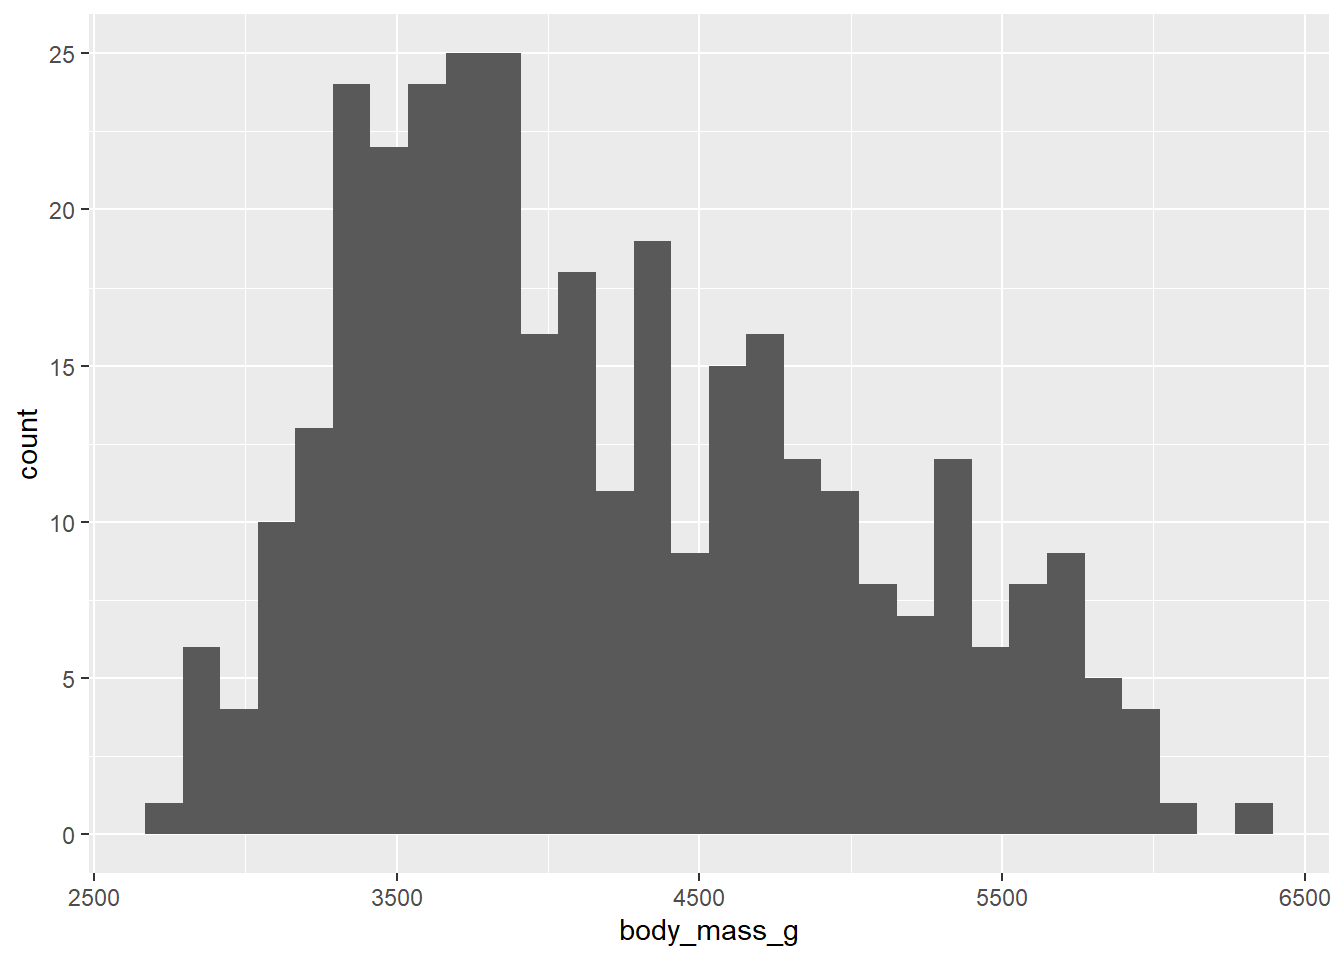
Create visualizations of the distribution of weights of penguins.

  1. Make a histogram by filling in the ... with the appropriate arguments. Set an appropriate binwidth. Hint: you can run names(data.set) in your console if you need a quick reminder on the variable names.
penguins |>
  ggplot( 
       aes(x = body_mass_g)) + #type variable name here
       geom_histogram() #type geom here
`stat_bin()` using `bins = 30`. Pick better value with `binwidth`.
Warning: Removed 2 rows containing non-finite outside the scale range
(`stat_bin()`).

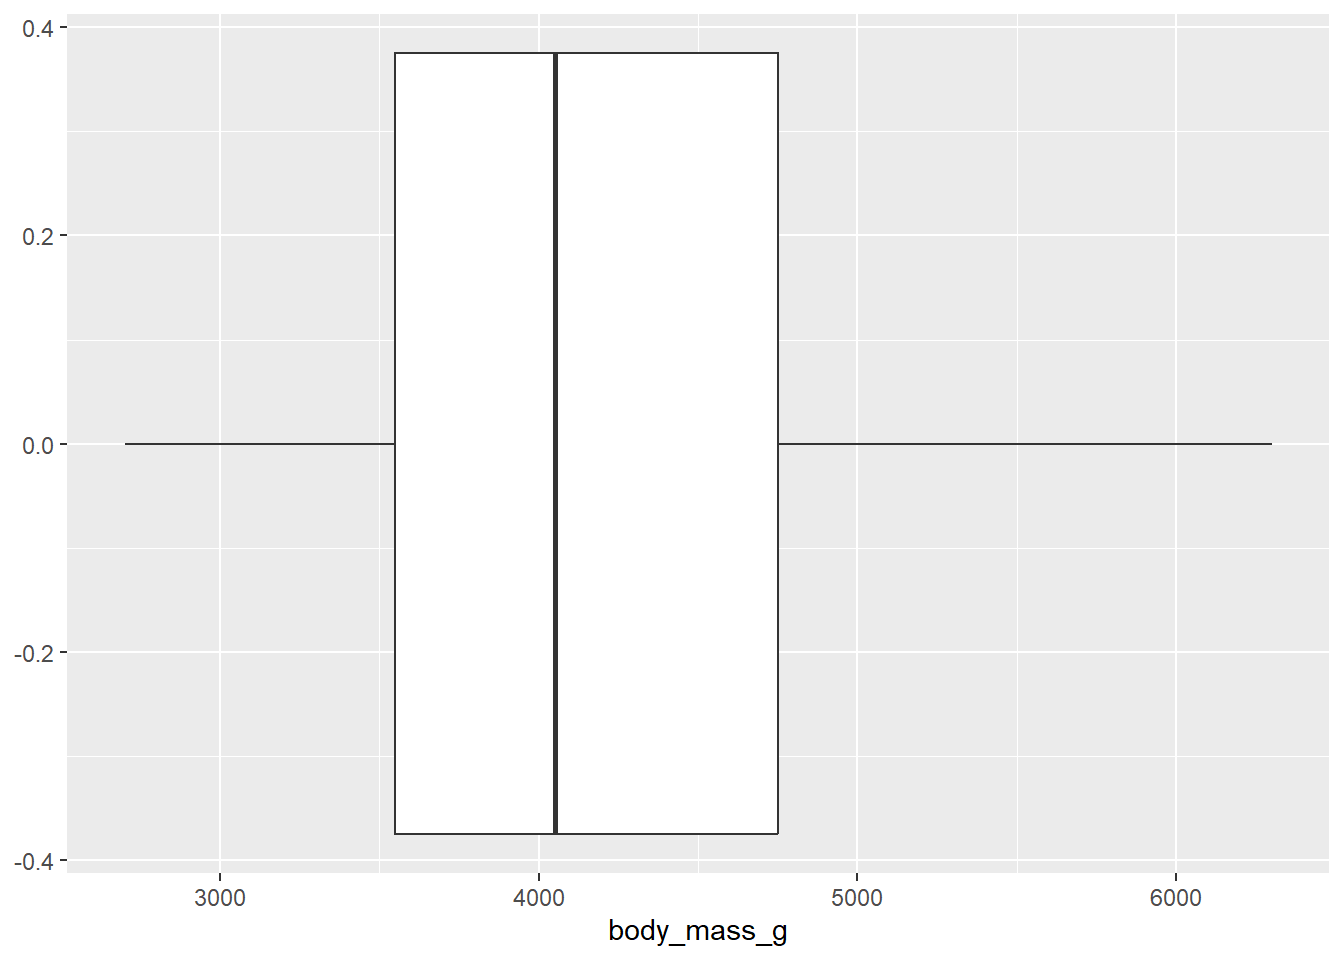
  1. Now, make a boxplot of weights of penguins.
penguins |>
  ggplot(
    aes(x = body_mass_g)
  ) + 
  geom_boxplot()
Warning: Removed 2 rows containing non-finite outside the scale range
(`stat_boxplot()`).

  1. Add a theme to your boxplot!

https://ggplot2.tidyverse.org/reference/ggtheme.html

penguins |>
  ggplot(
    aes(x = body_mass_g)) + 
    geom_boxplot() + 
    theme_minimal() # type theme here

Why can / should we use themes?

Looks nicer + can be more professional

Two variables

Note

Analyzing the relationship between two variables is called bivariate analysis.

Create visualizations of the distribution of weights of penguins by species. Note: aesthetic is a visual property of one of the objects in your plot. Aesthetic options are:

  • shape
  • color
  • size
  • fill
  1. Make a histogram of penguins’ weight where the bars are colored in by species type. Set an appropriate binwidth and alpha value. At the same time, comment each line of code to articulate what it’s doing.
penguins |>
  ggplot( 
       aes(x = body_mass_g, size = species )) +
       geom_histogram(binwidth = 200, alpha = .5)

What happens when we change color to fill?

When we make this change, it goes from outlining the objects to coloring them in.