class_data |>
  specify(response = correct_guess, success = "Correct") |>
  hypothesize(null = "point", p = .5) |> #fill in the blank
  generate(reps = 1000, type = "draw") |> #fill in the blank
  calculate(stat = "prop") #fill in the blank

## VS

iris_filter |>
  specify(response = Sepal.Length, explanatory = Species) |>
  hypothesize(null = "independence") |>
  generate(reps = 1000, type = "permute") |>
calculate(stat = "diff in means", order = c("setosa", "versicolor"))Finish Hypothesis Testing + Intro to Confidence Intervals
Lecture 22
Duke University
STA 199 - Fall 2023
2023-11-14
Checklist
It’s wonderful to be back!
– Clone ae-22
– Keep up with Slack
– Draft Report Due November 15
– Exam-2 released November 16
— Cumulative with a focus on content post Exam-1
Warm Up
Last Time:
\(\mu_{setosa} - \mu_{versi} = 0\)
\(\mu_{setosa} - \mu_{versi} \neq 0\)

Warm Up
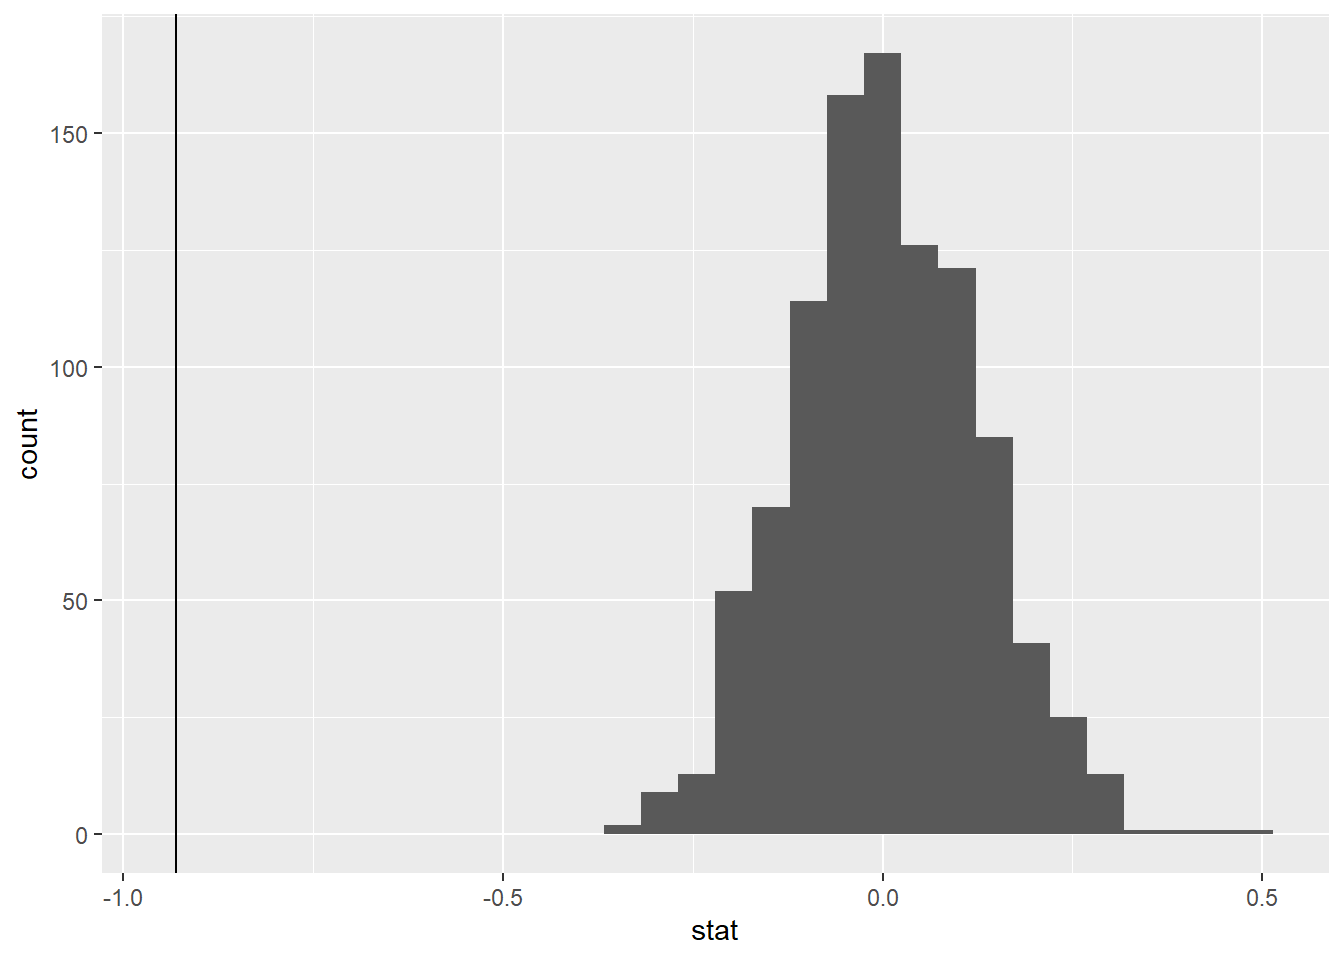
– How was one observation on this null distribution created?
– What is the p-value? How do we interpret it?
– Decision?
– Conclusion?
Note: The sample size for each species was 50.
Warm Up: R-Code
When creating null distributions, we have used the following code. Explain the differences between each code chunk.
Significance level
– \(\alpha\)
– “Fixed level testing”
– acts as a threshold for making decisions and conclusions
Significance level
– p-value > \(\alpha\) -> Fail to reject the null hypothesis
– p-value < \(\alpha\) -> Reject the null hypothesis
Significance level
– Set before the research study
– Set = the probability of a type 1 error
Where a type 1 error is incorrectly rejecting the null hypothesis
Issues with fixed level testing include:
– \(\alpha\) = 0.05 vs a p-value of 0.049…. vs 0.051
Scope of Inference
What we often write at the end of research reports
– Who can we generalize our results to?
– What type of relationship (causal vs association)
Scope of Inference
\(\mu_{setosa} - \mu_{versi} = 0\)
\(\mu_{setosa} - \mu_{versi} \neq 0\)
p-value < 0.001
Did we take a random sample?
Do we have random assignment?
Scope of Inference
– Do we have a random sample?
— Yes -> means our sample is representative -> apply our results to the entire population
— No -> apply results to our sample or a similar sample
Scope of Inference
– Do we have random assignment?
— Yes -> even out confounding variables across groups -> causal inference
— No -> confounding variables may be present -> association
Confidence Intervals
Confidence Intervals
– are a range of plausible values that our population parameter could be
– we make confidence intervals when we want to ESTIMATE
Confidence Intervals
By the end of class, we will
– know how to calculate confidence intervals using bootstrap methods
– understand what bootstrap methods are
– understand how the level of confidence influences our confidence interval
– understand how to interpret a confidence interval in the context of the problem
