Intro to Probability + Logistic Regression II
Lecture 19
Duke University
STA 199 - Fall 2023
2023-11-02
Checklist
– Clone ae-18
– HW-5 due November 6
– Check Slack / Sakai for announcement
– Check Formatting tab on website for a better explanation on how to embed equations into a document
– Project Feedback will be returned ~1 week. Communicate with your lab leader via email & Issues
Warm Up
– When is it appropriate to fit a linear model?
– When is it appropriate to fit a logistic model?
Warm Up
– In logistic regression, we can model two different values as our response. What are they?
Model Selection
– What statistical tools have we learned to compare sets of models in order to find our “best” overall model?
Probability
– Besides AIC and Adjusted R-Squared, we can also look at model performance and predicted probabilities.
We can use this to answer to the following questions to help us decide a model:
– Probability that we correctly predict a spam email given that the email is actually spam
– Probability that we correctly predict a non-spam email given that the email is actually not spam
In Practice
– We fit a model
– pick a threshold
– evaluate how well the model does

Test + Training Data Sets
A full data set is broken up into two parts
– Training Data Set
– Testing Data Set
Test + Training Data Sets
– Training Data Set - the initial dataset that you fit your model on
– Testing Data Set - the dataset that you test your model on
In R
split <- initial_split(data.set, prop = 0.80)

train_data <- training(split)
test_data <- testing(split)- You will practice this in lab next week + class on Tuesday!
Probability
In order to answer these types of questions
– Probability that we correctly predict a spam email given that the email is actually spam
We need to be able to calculate probabilities from events!
Probability Crash Course
Probability in 199
– logistic regression
– relationships across categorical variables
– p-values (Hypothesis Testing)
Goals
– have a working understanding of the terms probability and sample space
– compute probabilities of events from data tables
– Define sensitivity and specificity
– create a contingency table using pivot_wider() and kable() (if time)
Probability
– The probability of an event tells us how likely an event is to occur
– the proportion of times the event would occur if it could be observed an infinite number of times
- Range?
An Event
– is the basic element to which probability is applied, e.g. the result of an observation or experiment
Example: A is the event that an email is spam
Example: B is the event that an email was predicted to be spam
Note: We use capital letters, to denote events
The Opposite of the event
– If event A is that an email is spam… what is the opposite?
For any event A, there is a complement \(A^c\)
Think about c as “not”
Pr(A) + Pr(\(A^c\)) = ?
Sample Space
– A sample space is the set of all possible outcomes
– Each outcome in the sample space is mutually exclusive meaning they can’t occur simultaneously.
Sample Space
– The sample space for year in school is….?
{Freshman, Sophmore, Junior, Senior}
each item brackets is a distinct outcome
The probability of the entire sample space is 1
Example
Suppose you are interested in the probability of a coin landing on heads. Define the following:

– Event and compliment
– Sample space
2 Events
Calculating probabilities from a 2 x 2 table

– What is the probability that an email was predicted to be spam?
– What is the probability that an email was not spam?
More Complicated Probabilities
– And
– Or
– Conditional
— Sensitivity & Specificity
Conditional Probabilities
– “Given that an even has already happened…..”
– A | B
– Cuts up our contingency table

– Given that the email was actually spam, what is the probability that our model predicted the email to be spam?
– Given that the email was not spam, what is the probability that our model predicted the email to not be spam?
Sensitivity and Specificity
– Given that the email was actually spam, what is the probability that our model predicted the email to be spam? (Sensitivity)
– Given that the email was not spam, what is the probability that our model predicted the email to not be spam? (Specificity)
We use these measures for model selection purposes
And
– Two things are happening at the same time
– A & B

– What is the probability that an email was spam AND we predicted the email not to be spam?
– What is the probability that an email was not spam AND we predicted the email not to be spam?
Or
– At least one of the evens are happening
– A or B
For OR probabilities, we will use the following probability rule:
P(A or B) = P(A) + P(B) - P(A and B)

– What is the probability that an email was spam OR we predicted the email to be spam?
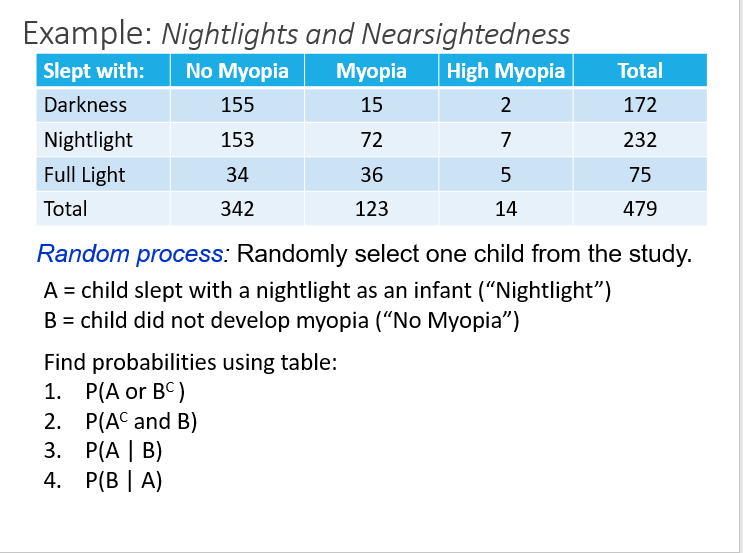
Another Example

Solutions
-- P(A or \(B^c\)) = 0.484 + 0.286 - 0.165
-- P(\(A^c\) and B) = 0.395
-- P(A | B) = 0.447
-- P(B | A) = 0.659
ae-18
Comparing two categorical variables in R
– pivot_wider
– kable
Sensitivity & Specificity
– Sensitivity ~ True Positive
– Specificity ~ False Negative
What happens as we move the threshold?
