Simpson’s Paradox & Model Selection
Lecture 17
Duke University
STA 199 - Fall 2023
2023-10-26
Checklist
– Clone ae-16
– HW-4 2a was (might have?) graded incorrectly
– HW-5 due on Tuesday
– Project proposal due Wednesday
– HW-6 is out now (Due last day of class)
Warm Up
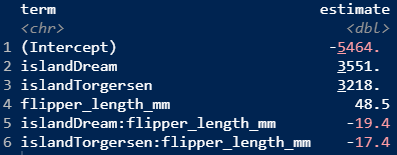
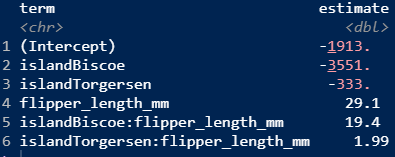
Why are these sets of model output different?


Warm Up: Model Selection
Suppose a researcher was interested in modeling students test scores in college by the following variables in an additive model:
Parents Education; State
In a separate model, the researchers also include height.
– Which model would produce the higher \(R^2\) value? Why?
– Should we use \(R^2\) to select the “most appropriate model”?
Goals
– Understand why including more than one variable can be critical (Simpson’s Paradox)
– Use statistical tools to compare models with different number of predictors
ae-16
Simpson’s Paradox

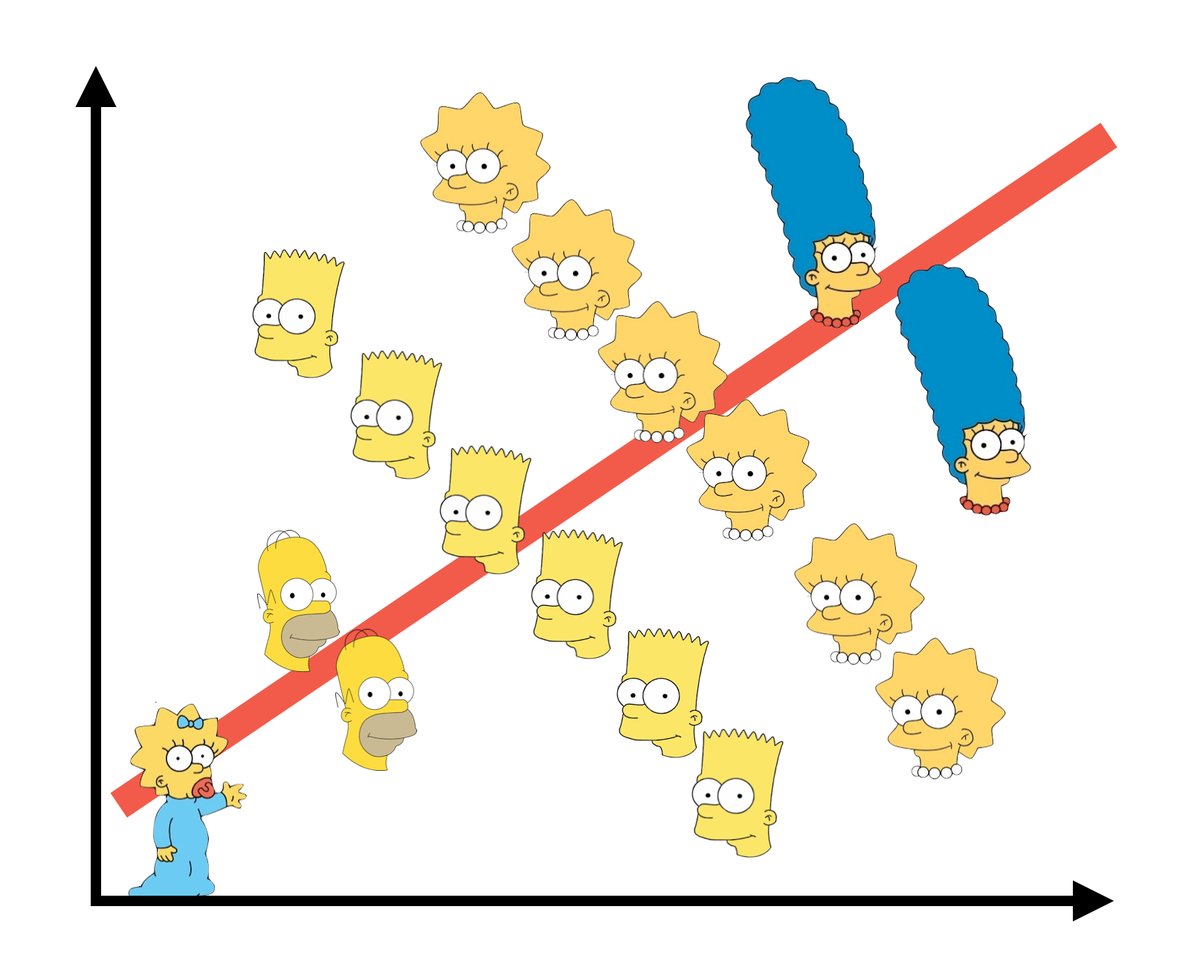
Simpson’s Paradox is a statistical phenomenon where an association between two variables in a population emerges, disappears or reverses when the population is divided into subpopulations
Simpson’s Paradox

Model Selection
Occam’s Razor
In philosophy, Occam’s razor is the problem-solving principle that recommends searching for explanations constructed with the smallest possible set of elements. It is also known as the principle of parsimony
Model Selection
The best model is not always the most complicated:
– R-squared (bad)
– Adjusted R-squared
– AIC
– Stepwise selection
Adjusted R-squared
– What is it?
– How is it different than R-squared?
Adjusted R-squared

Adjusted R-squared
– Does not have the same interpretation as R-squared
– Generally defined as strength of model fit
– Look for higher adjusted R-squared
AIC (Akaike Information Criterion)

– where k is the number of estimated parameters in the model
– log-likelihood can range from negative to positive infinity
– You may see the idea of likelihood in future classes. For now, it suffices to know that the likelihood is a measure of how well a given model fits the data. Specifically, higher likelihoods imply better fits. Since the AIC score has a negative in front of the log likelihood, lower scores are better fits. However, k penalizes adding new predictors to the model.
ae-16
Important
Alternatively, one could choose to include or exclude variables from a model based on expert opinion or due to research focus. In fact, many statisticians discourage the use of stepwise regression alone for model selection and advocate, instead, for a more thoughtful approach that carefully considers the research focus and features of the data.
Model Selection Take-away
– Higher adjusted r-squared = Better fit / preferred model
– Lower AIC = Better bit / preferred model
– We can get at this information using glance in R
– Prior to the selection of models, choose one criteria and stick with it
Something to think about
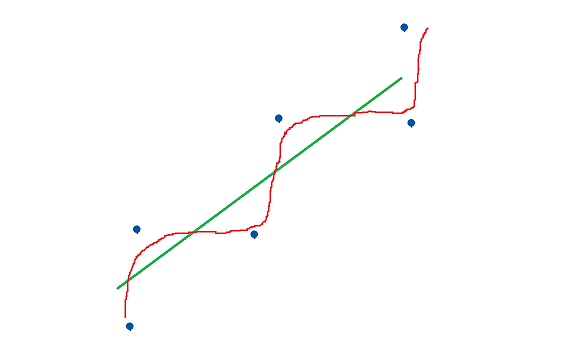
We want our covariates to do a good job at modeling our response y. Is the goal for \(R^2\) = 1? Is the goal to have a perfect fitting model?

In Summary
R^2 doesn’t let us compare between models with a different number of predictors
We can compare models with a different number of predictors by penalizing the existence of each predictor in the model.
