Working with multiple data frames
Lecture 7
Duke University
STA 199 - Fall 2023
Invalid Date
Checklist
– Clone ae-06
– Make sure you are keeping up with Preparation Videos / Readings
– Make sure you are keeping up with Slack
– HW due tonight at 11:59
– Exam I released September 28th ~ 5:00 PM
Duke SSMU


Lab Question
“Creating a new data frame or saving a plot as a variable”
<-Note: If you save over your data frame incorrectly (or at all), you have now changed your data and going back to other questions may result in old code not working.
Solution: Run your code from the beginning of the document so you start with a freshly loaded in data set!
Exam I
– Take home
– Open Notes / Internet / etc
Exam
– Coding + Short answer questions
– Extension questions
– Can NOT be late
– Pull -> Commit -> Push after every question
Warm Up: Scales
– Open up ae-06-scales
– scale_x_continuous
– scale_y_continuous
Warm Up: if_else
– Open up ae-06-if-else
– Often used with mutate to create new variables
– Make bins from quantitative variables
– Make bins from character data
Goals
– Understand join functions
– Join multiple data frames
Motivation
Messy data
– The sheer volume of information is sometimes referred to as “messy” data, because it’s hard to make sense of it all.
Messy data

How?
Joining datasets
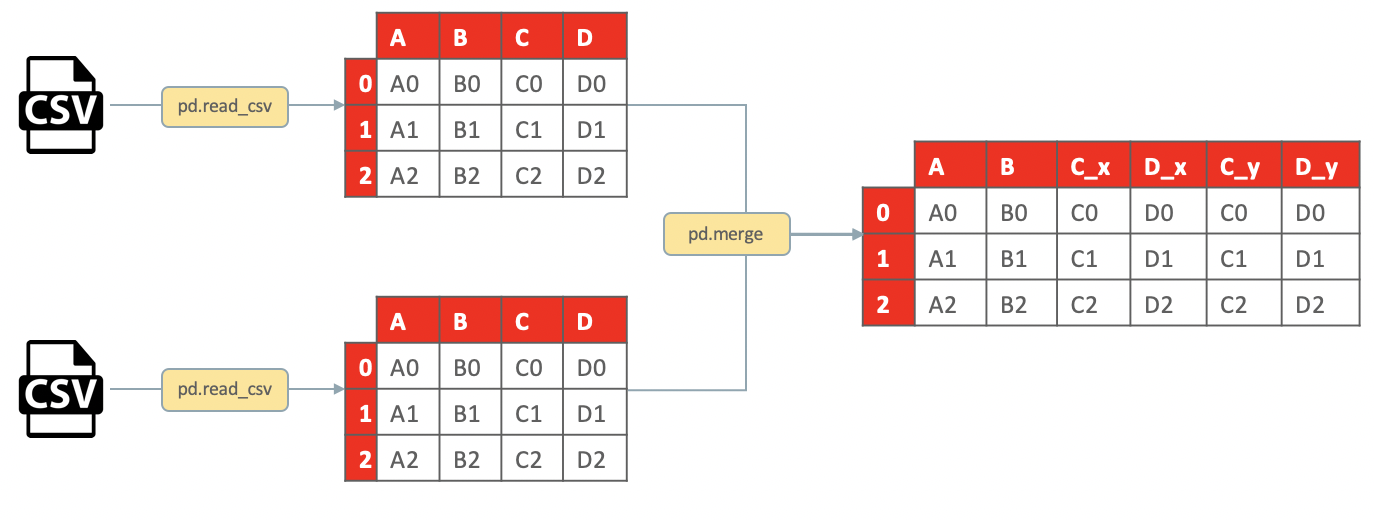
Data merging is the process of combining two or more data sets into a single data set. Most often, this process is necessary when you have raw data stored in multiple files, worksheets, or data tables, that you want to analyze together.
Joining datasets
– Left Join
– Inner Join
– Right Join
– Full Join
Joining datasets

AE-06
– Joining Data
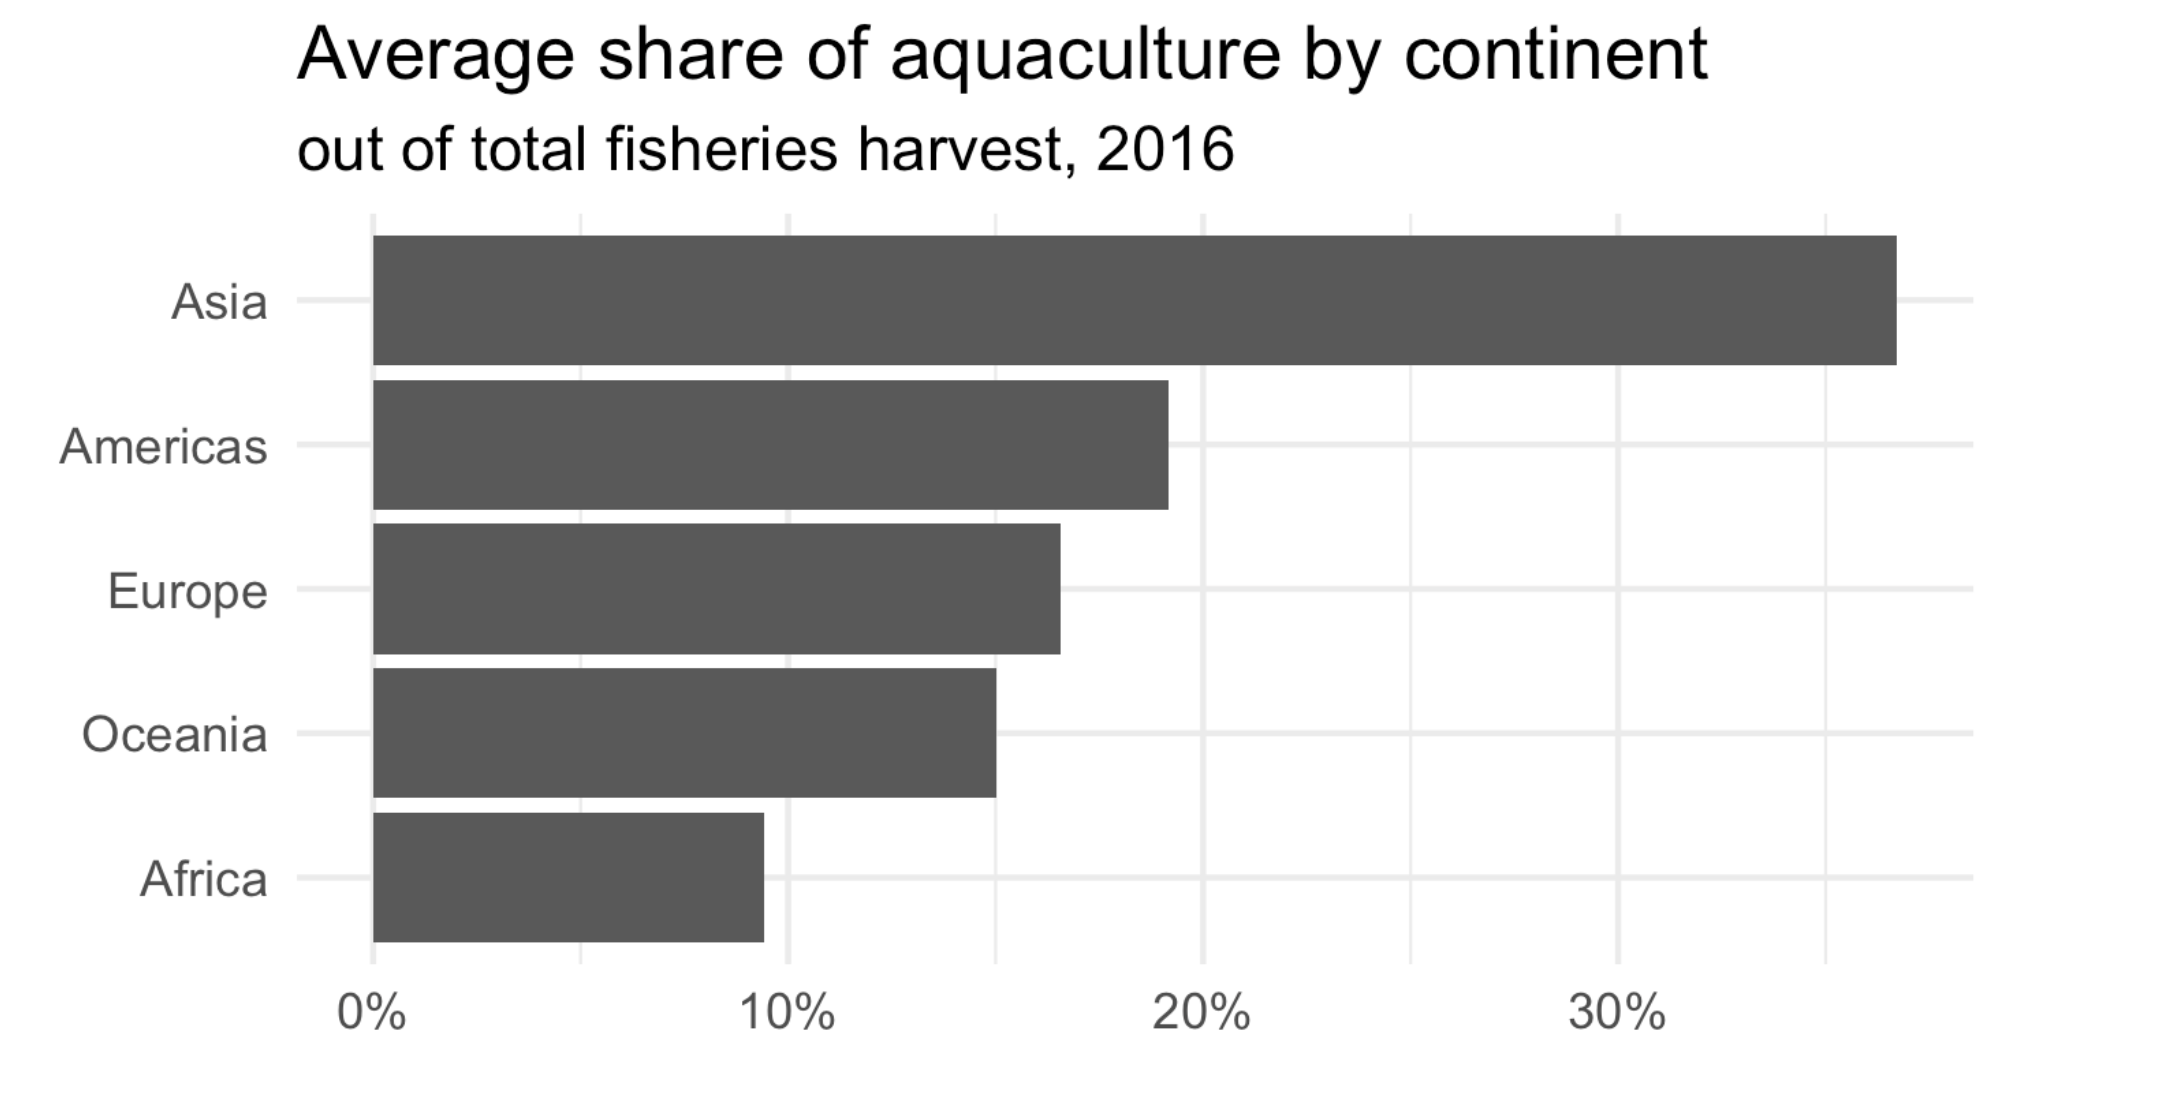
– Recreate:

Recap of AE
– This is important! Data are messy!
– Think carefully about the join you use
